


(Temperature, IR, Humidity)


Thanks to controller boards such as Arduino, sensors are easy to use and affordable, which makes them very attractive as an educational resource. This lnstructable aims to bring teachers closer to the use of low-cost sensors in the Physics class. We will offer examples of practical activities in which sensors are used as a tool to illustrate physical concepts, to show the relationship between magnitudes in a practical way, or to take measurements in laboratory activities. The aim is to make physics classes more practical and motivating, and to encourage students to be creators and not just consumers, of technology.
To show some examples of the use of sensors in secondary education, we’ll measure temperature, infrared radiation, and humidity. For each sensor, we start with a short introduction of the sensor, and then we show how to connect and program it, giving example programs. Finally, some practical activities are given to show how to include the use of the corresponding sensor in the classroom. Specifically, we’ll measure the following magnitudes:
- Temperature, both with the LM35 Analog Temperature Sensor and with the waterproof version of the DS18B20 Digital Temperature Sensor.
- Infrared radiation, using the Flame Sensor.
- Humidity, with the DHT22 Humidity and Temperature Sensor
We think that the central point of this activity are the physics concepts that we’re dealing with, and technology is just a teaching aid. For this reason, we’ve tried to simplify the programs and the hardware as much as possible, so technology does not distract students from the important thing. But if students are already familiar with Arduino, you can encourage them to make more complex programs or to add additional components like an LCD screen to read the measured values and an external power bank to make it portable. Or they can make a data logger, saving the measured values in an SD card. And why not design and 3D print an encasing for it? The possible improvements are endless!
Learning objectives
- Connect and program sensors with Arduino.
- Measure temperature, infrared radiation, and humidity.
- Analyze experimental data and extract conclusions.
Science topics
We’ll use different sensors to measure several physical magnitudes, so we’ll cover a wide range of science topics:
- Thermometric scales
- Heat transfer
- Electromagnetic radiation
- Changes of state
- Thermal equilibrium
Grade level
Secondary education (13-18 years)
Before starting
To read the values measured by the sensors we’ll use the Arduino programming language in the Arduino IDE. To keep this Instructable reasonably short, we’ll assume that you are already familiar with Arduino. If, on the other hand, this is your first time with this microcontroller, we recommend you to visit this Instructable: “A Beginner’s Guide to Arduino”, where you’ll find all the necessary information on how to start using the Arduino board.
So from now on we’ll assume that you have installed the Arduino IDE in your computer, and that you already know how to write a sketch, how to add a library to the Arduino IDE, how to upload a sketch to the board, and how to open the serial monitor.
Material
- Computer with the Arduino IDE (https://www.arduino.cc/en/Main/Software)
- Arduino UNO board
- LM35 Analog Temperature Sensor
- Flame Sensor Module
- DHT22 Temperature and Humidity Sensor
- DS18B20 Digital Temperature Sensor
- Jumper wires
- One 4,7 kOhm resistor (for the DS18B20 temperature sensor)
- Breadboard
The material used in this activity can be bought from a local reseller or from any web store that sells electronic components.
Acknowledgments
The diagrams and schematics in this Instructable have been adapted by the author, using Inkscape, from the following sources: Fritzing, Inductiveload (Wikimedia Commons), arduinomodules.info, AdaFruit, Flaticon and Leonardo Potsay (Wikimedia Commons). Thank you all for sharing!
Teacher Notes
Teachers! Did you use this instructable in your classroom?
Add a Teacher Note to share how you incorporated it into your lesson.
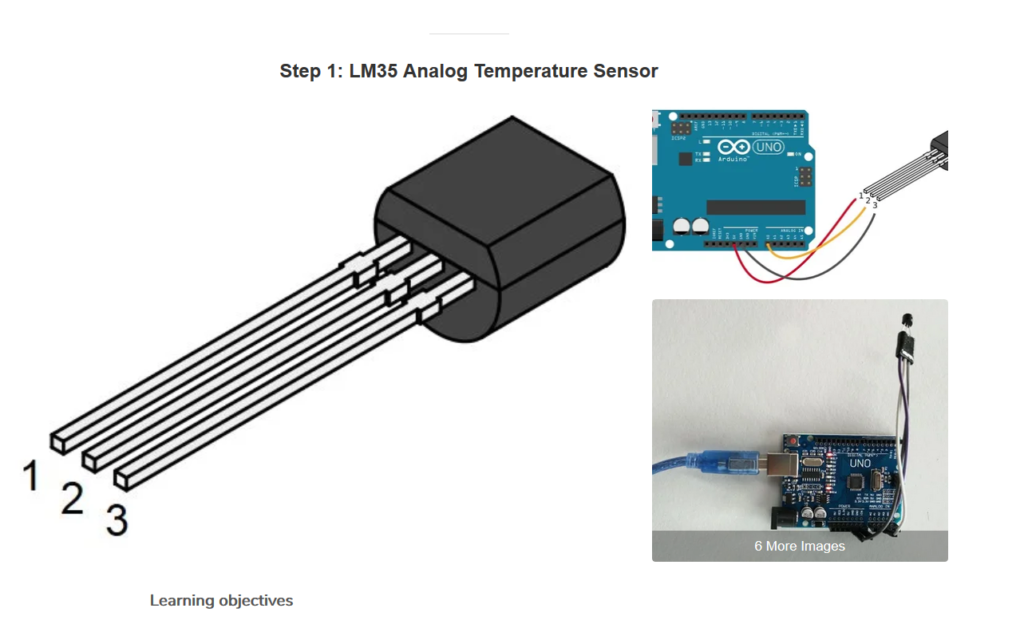
Step 1: LM35 Analog Temperature Sensor
Learning objectives
- To measure temperature
- To convert temperature in degrees Celsius into degrees Fahrenheit and Kelvin.
The LM35 sensor is an inexpensive device that can be used to easily measure temperatures between 2 °C and 150 °C, with a 0.5 °C accuracy at room temperature. Thanks to its internal integrated circuit there’s no need for any external calibration, since the measured values are directly proportional to temperature in degrees Celsius. According to the sensor’s datasheet, the relationship between the voltage it measures and the temperature is 10 millivolts = 1 °C.
Datasheet
http://www.ti.com/lit/ds/symlink/lm35.pdf
Connecting the sensor
The sensor has three pins that can be connected directly to Arduino (or, if you prefer, you can use a breadboard). Pins 1 and 3 power the sensor through the Arduino board: pin 1 is connected to +5 V and pin 3 to GND (see the attached images). The pin in the middle is the data pin, meaning that Arduino uses this pin to read the values measured by the sensor. It must be connected to any of Arduino’s analog inputs (any of the six pins marked as “Analog In” in the board, from A0 to A5). We’ll assume that the sensor is connected to analog pin 0, so if you choose a different pin you need to change the programs accordingly.
Reading the sensor
Once you have connected the sensor, let’s check that everything is working properly. To do so, try the following program that reads an analog signal in Arduino:
void setup() {
  Serial.begin(9600);
}

void loop() {
 int sensorValue = analogRead(0);
 Serial.println(sensorValue);
 delay(1000);
}
Copy the sketch in the Arduino IDE and upload it to your
board. Once the upload has finished, open the serial monitor to read the
measured values. You’ll see a column of integer values. Heat the sensor
with your fingers. Do you see how the numbers change? And what if you
put it close to an ice cube? Anyway, these values aren’t what we were
expecting… because the analogRead() function returns integer values between 0 and 1023. So let’s transform them into degrees Celsius.
Expressing the data in degrees Celsius
When the analogRead() function returns the value 0, it means that the voltage read by Arduino is 0 V, and the value 1023
means that the voltage is 5 V. Taking this into account, we can
transform the analog values into voltage just by doing this simple
calculation:
volts = sensorValue*(5.0/1023)
where volts is the voltage (in volts) and sensorValue is the analog value measured by Arduino.
According to the LM35 sensor’s datasheet, the relationship between voltage and temperature is linear, with a change of 1 °C in temperature resulting in a change of 10 millivolts in voltage. So first we convert the volts to millivolts:
millivolts = volts*1000
and then millivolts to degrees Celsius:
degreesC = millivolts/10
Now the raw values measured by the Arduino board are expressed in degrees Celsius. Simple, isn’t it?
Putting it all together, the final program is as follows:
void setup() {
  // Initializing the serial communication at 9600 bits of data per second
  Serial.begin(9600);
}

void loop() {
  // Reading the value of the sensor from analog pin 0
  // and storing the value in a variable called sensorValue
  // sensorValue stores integer values (int)
  int sensorValue = analogRead(0);

  // Transforming raw input (0-1023) into voltage in volts (0-5 V)
  // volts stores decimal values (float)
  float volts = sensorValue*(5.0/1023);

  // Transforming voltage in volts into millivolts
  float millivolts = volts*1000;

  // Transforming voltage in millivolts into temperature in degrees Celsius
  float degreesC = millivolts/10;

  // Printing the output in the serial monitor
  Serial.println(degreesC);

  // Delay in between reads (in milliseconds)
  delay(1000);
}
As you can see, this sensor is very simple to connect and program, making it very appropriate as an introduction to the use of sensors in the physics classroom.
Activities for students
This sensor is calibrated to give the temperature in degrees Celsius. Modify the program in order to convert the measured temperatures into degrees Fahrenheit and Kelvin.
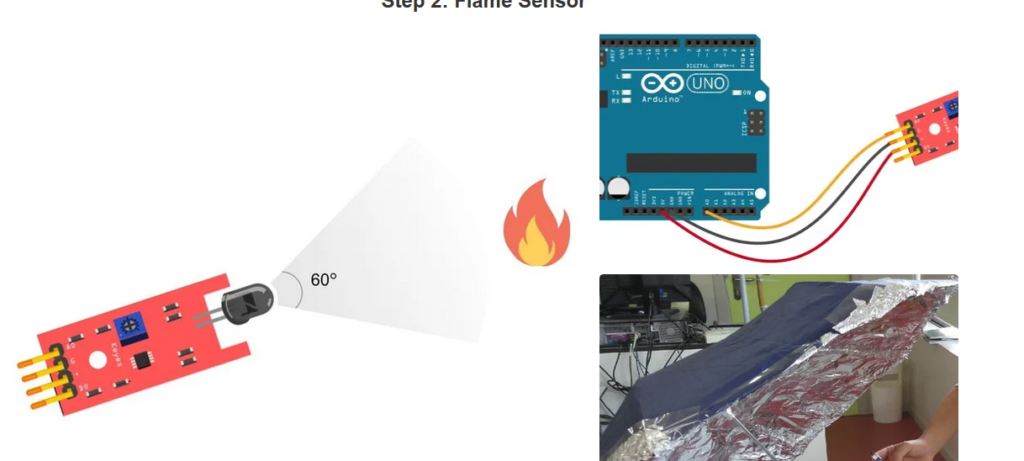
Step 2: Flame Sensor
Learning objectives
- To measure infrared radiation
- To detect sources of infrared radiation.
- To analyze how electromagnetic radiation is transmitted and reflected.
The flame sensor is a module that detects the infrared (IR) radiation that comes from a fire, the Sun, and other sources of heat. It is sensitive to short wavelength infrared radiation, that is, radiation with a wavelength in the range 760-1100 nanometers. The detection angle is approximately 60°.
When this sensor receives IR radiation the output signal is low (close to 0), and when it doesn’t detect radiation the output signal is high (close to 1023). In other words, low values in the sensor mean high levels of IR radiation, and high values in the sensor mean low levels of IR radiation.
Connecting the sensor
The sensor can be connected directly to Arduino, but you can as well use a breadboard. It has four pins, but we’ll be using only three of them. The sensor’s pin labeled as + (or VCC) is connected to +5 V in Arduino, and pin G (or GND) in the sensor is connected to ground in Arduino. Pin AO (Analog Output) is the analog data pin, so Arduino reads through this pin the values measured by the sensor. Connect it to any analog input in your board (from A0 to A5). The Digital Output (DO) pin in the sensor is not connected.
Reading the sensor
To try this sensor, you can use the same program that we used to read the analog signal of the LM35 temperature sensor:
void setup() {
  Serial.begin(9600);
}

void loop() {
  int sensorValue = analogRead(0);
  Serial.println(sensorValue);
  delay(1000);
}
Upload the sketch and open the serial monitor. Aim the sensor to the sunlight. Now take it inside a dark room. Do you see how the values change depending on where the sensor is pointing to?
Transforming raw values into percentage
The
raw values measured by the sensor give us a good idea of how the sensor
works, and how the amount of IR radiation changes depending on the
environmental conditions. But they are not very descriptive. So let’s
transform them into a percentage. This way a value of 0 % would mean “No
IR radiation at all” and 100 % would be the maximum IR radiation that
the sensor can measure. To achieve this we’ll use a very useful function
in Arduino: the map() function. Try this code (you may
want to adjust the potentiometer in the module to obtain a suitable
range in the measured values):
// The flame sensor is connected to analog pin 0
const int sensor = 0;

void setup() {
  // Initializing the serial communication at 9600 bauds
  Serial.begin(9600);
}

void loop() {
  // Reading the value of the sensor
  // and storing it in a variable called sensorValue
  int sensorValue = analogRead(sensor);

  // Transforming the measured value into percentage using map()
  // map(value, fromLow, fromHigh, toLow, toHigh)
  int percentage = map(sensorValue, 0, 1023, 100, 0);

  // Printing the values on the serial monitor
  Serial.print("IR radiation: ");
  Serial.print(percentage);
  Serial.println(" %");

  // Delay in between reads (in milliseconds)
  delay(1000);
}
Activities for students
1. Select different light sources (the Sun, a flame, an incandescent light bulb, an LED light…). Are they a source of infrared radiation? Compare the amount of IR radiation that they emit.
2. Aim the sensor to an area that doesn’t receive direct sunlight, and read the value measured by the sensor. Now, without changing the position of the sensor, put a reflecting material (for example, a surface covered in aluminum foil) that reflects the sunlight into the sensor. Compare the values measured in both situations.
3. What materials are transparent to infrared radiation? What materials block this radiation? Try with cardboard, glass, plastic, etc.
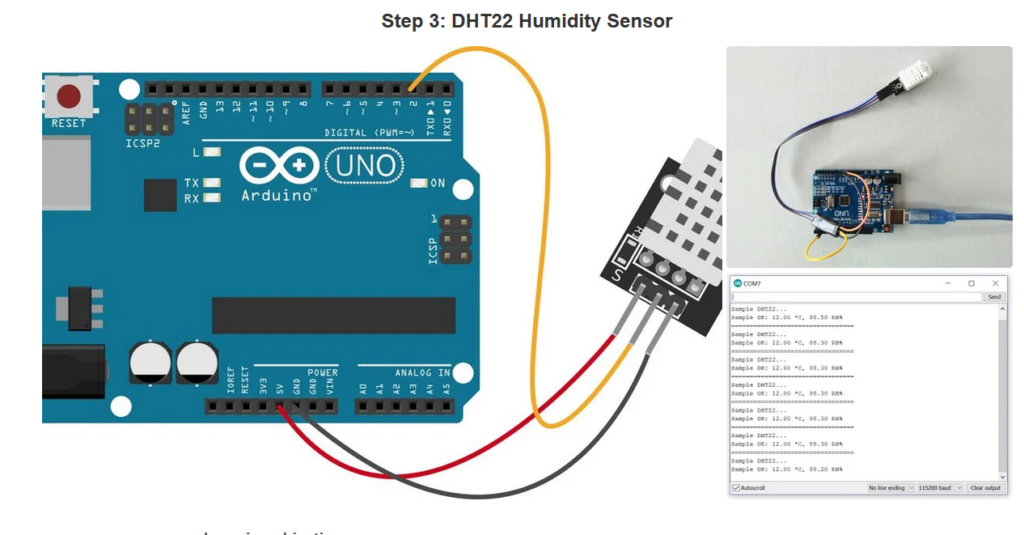
Step 3: DHT22 Humidity Sensor
Learning objectives
- To measure humidity.
- To analyze how temperature affects evaporation.
The DHT22 temperature and humidity sensor is a device that contains a thermistor to measure temperature and a capacitive sensor to measure humidity. It also includes a chip with the necessary information to calibrate the sensor, making it very easy to read temperature and humidity with a microcontroller like Arduino.
Datasheet
https://akizukidenshi.com/download/ds/aosong/AM2302.pdf
Connecting the sensor
Although the DHT22 sensor has four pins, we’ll use the version that comes mounted in a module. This way we’ll avoid the use of an external resistor, and the number of pins is reduced to three.
Connect the pins in the module to the Arduino board as follows:
- DAT or OUT (data): any digital pin in Arduino
- VCC or + (positive power): +5V
- GND or – (negative power): GND
Reading the sensor
To read this sensor, we must first add a library to the Arduino IDE. The library we’ll use to read the DHT22 sensor is called SimpleDHT. You can download it from this link: https://www.arduinolibraries.info/libraries/simple-dht.
Once the library is added, you can try an example program to check that the sensor is working correctly. Go to File > Examples, and open the DHT22Default sketch in the SimpleDHT examples. Have a look at the code of this example. In the setup, the serial communication is initialized at a rate of 115200 bauds,
so you’ll probably have to adjust this value in the serial monitor (or,
if you prefer, just change this number in the sketch). You must as well
take into account that this sketch assumes that the sensor is connected
to digital pin 2. One last important thing worth mentioning about this
sensor is that, according to the datasheet, its sampling rate is 0,5 Hz,
meaning that you can only take new data every 2 seconds.
Now upload the example sketch and open the serial monitor to read the values of humidity and temperature.
Activities for students
Take one container and fill it with cold water. Put the humidity sensor close to the surface of the water, and record how the humidity has changed after one minute. Now take an identical container and fill it with the same amount of water, but this time with warm water. Measure the change in humidity in the same amount of time. Compare both values and extract a conclusion.
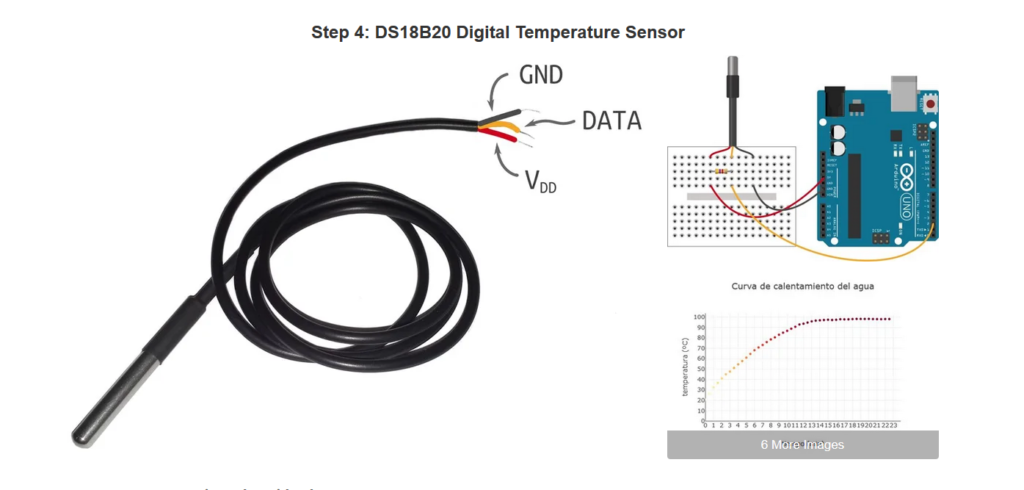
Step 4: DS18B20 Digital Temperature Sensor
Learning objectives
- To measure temperature.
- To plot the heating curve of a pure substance.
- To study how the temperature of two substances in thermal contact changes.
- To analyze how the amount of infrared radiation absorbed by an object is affected by its color.
The DS18B20 digital temperature sensor is a cheap and easy to program device that measures temperatures in the range of −55 ºC to 125 ºC. Its precision is 0.5 ºC for temperatures between −10 ºC and 85 ºC, and 2 ºC for other temperatures.
This sensor uses the 1-Wire protocol for communication with the microcontroller. As each DS18B20 has its own unique serial number, you can connect several sensors to one Arduino pin.
We’ll use the waterproof version of this sensor because it can be used to measure temperature in liquids.
Datasheet
https://datasheets.maximintegrated.com/en/ds/DS18B20.pdf
Connecting the sensor
The DS18B20 sensor has three pins: two of them are used to power the sensor and the third one to read the data. In the waterproof version the pins can be identified by the color of the wire: red is for positive power (VDD), black for ground (GND) and yellow for data. So the connections to the Arduino board are as follows:
- Red wire (positive power): +5V
- Black wire (negative power): GND
- Yellow wire (data): any digital pin in Arduino
But this time there’s one more thing to connect: the 1-Wire bus requires a 4.7 kOhm pull-up resistor between the positive power pin and the data pin. Use a breadboard to make the connections (see the attached images).
Reading the sensor
To use the DS18B20 sensor you need to add two libraries to the Arduino IDE: OneWire, for the communication between the sensor and Arduino, and DallasTemperature, that carries out the calculations in the sensor. You can download them from these links:
- OneWire: https://www.arduinolibraries.info/libraries/one-wire
- DallasTemperature: https://www.arduinolibraries.info/libraries/dallas-temperature
Add both libraries to your IDE. Again, to test the sensor you can try an example sketch. In File > Examples, open the Simple sketch in the DallasTemperature examples. Connect the sensor, upload this sketch to your board, open the serial monitor and read the temperatures.
Analyzing the data
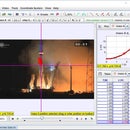
If you only want a qualitative analysis of how temperature changes over time, instead of reading the data in the serial monitor you can visualize them in the serial plotter. To do so, go to Tools > Serial Plotter and you’ll see the real-time graph of temperature versus time.
You may need to further analyze the data in a spreadsheet. In this case, instead of the example sketch you can use this program that measures temperature approximately every second:
#include <OneWire.h>
#include <DallasTemperature.h>

const int BUS = 2;	// The sensor is connected to digital pin 2
OneWire oneWire(BUS);
DallasTemperature sensor(&oneWire);

void setup() {
  Serial.begin(9600);
  sensor.begin();
}

void loop() {
  sensor.requestTemperatures();
  Serial.println(sensor.getTempCByIndex(0));
  delay(1000);
}
When you run this sketch, the measured temperatures will appear in a column in the serial monitor. So when you have finished taking the measurements, just copy these values and paste them in a spreadsheet.
Activities for students
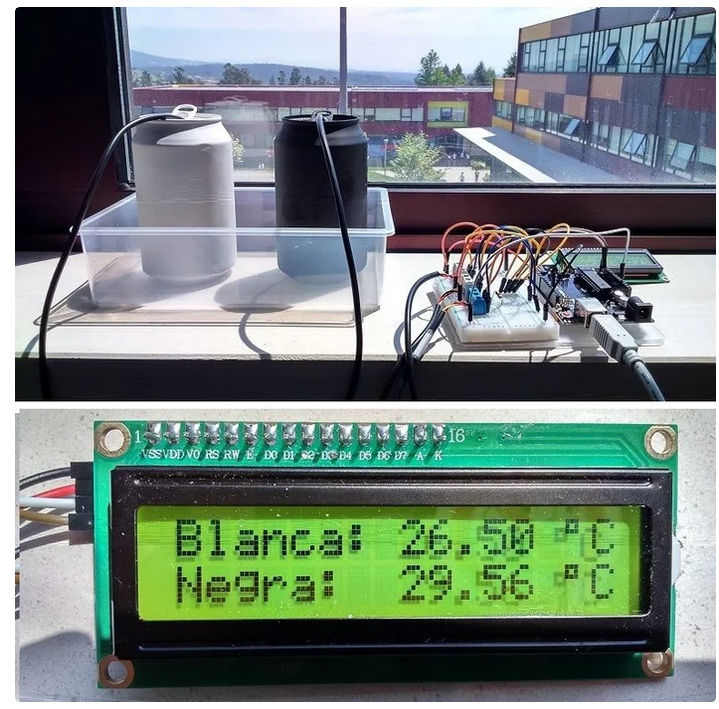
1. Take two identical empty soda cans. Paint one of them in white, and the other in black. On a sunny day, pour the same amount of tap water in both cans, and introduce a waterproof temperature sensor in each of them. Leave them in the sun for at least half an hour. After this time, check the temperature of the water in the cans. How does the temperature in both of them compare? Can you explain why?
2. Put a small amount of cold water inside a beaker. In a smaller beaker (or plastic cup), pour hot water. With two different sensors, measure the temperature of the water in each beaker. Now carefully introduce the smaller beaker into the beaker with cold water, and record how the temperature in each beaker changes over time, until thermal equilibrium is achieved. Plot the temperature-time graph of the water in both beakers.
3. Heating curve of water (this activity should be carried out as a demonstration by the teacher, for it involves boiling water). Put some water at room temperature in a container, and heat it until it boils. Record the temperature every few seconds. Plot the graph of temperature versus time to obtain the heating curve of water.

Participated in the
Classroom Science Contest


 Users Today : 494
 Total Users : 133701
 Views Today : 806
 Total views : 484092
 Who's Online : 0
 Your IP Address : 216.73.217.54